Why no breakthrough yet? Or, why is it 'taking so long' to test COVID-19 treatments?
Many many possible medicines are being touted as possibly being helpful in fighting COVID-19. Here’s a small list where we have some initial results or at least anecdotes:
- (hydroxy)chloroquine, with azithromycin or zinc: This is the “tech-bro” favorite right now, partially based on recommendations from Elon Musk and Donald Trump, two noted medical professionals. There have been a few reports on this working or not working. This article argues that an alternation of negative and positive results actually is to be expected, even if the treatment is fairly effective, which it might be.
- Remdesivir: this was the original hope since it was known to be active against SARSv1, and there are plausible reasons for it working against COVID-19, SARSv2, as well. Some anecdotal reports of effectiveness in some cases. Formal trials ongoing, incidental access outside of trials is now being withheld. This makes sense.
- Tocilizumab, similars: modulate the aberrant immune response that is killing people. Many anecdotal positive results.
- Camostat mesilate, a Japanese repurposed medicine that has some good anecdotes. Great description here.
- Convalescent sera: use antibodies from recently recovered patients to help cure people, or convey temporary immunity.
- Plus many more: favipiravir, nafamostat, BCG TBC vaccination…
It is important to note that with the exception of tocilizumab, all these medicines/treatments were on the radar very quickly. Given prior research on SARS, it was known these might be useful.
So given that this epidemic has been going on for “three whole months now”, why don’t we yet know what works and what doesn’t? And why are conflicting results being reported?
Some reality
If there were a 100% effective medicine that worked in all stages of the disease, and if it helped rapidly, we would know by now of course. Such medicines are however extremely rare. In general, many medicines work 20%-50% of the time at most, and then only when prescribed at the appropriate time. Very often a combination of medicines/treatments is required.
To see what is going on, it is helpful to assume any medicine will be at most 50% effective initially, and then only when prescribed at the right time.
What would such a treatment look like from the perspective of a reasonably sized hospital?
Note that a 50% effective medicine would already be exceptionally useful, think of it as a way of doubling your ICU capacity for example! Effective can mean many things, like reducing the time spent in hospital, reducing the intensity/invasiveness of treatment required, but for example it could also mean preventing infection or concretely saving a life.
Statistics are incredibly anti-intuitive
For starters, medical trials, epsecially informal ones conducted by medical professionals trying different things, are tremendously difficult to get right. Subtle covert and overt biases can skew results tremendously, even with the best of intentions. Simple inconsistencies in what results get counted can similarly distort the outcome.
But even a trial that is conducted ‘perfectly’ can give completely anti-intuitive results due to statistics.
So as an experiment, imagine a general ward receiving a lot of COVID-19 patients, say 50 per day. Some of these people progress to needing oxygen therapy, some progress beyond that and need to be moved to an intensive care unit. Let’s say that 20% of patients need high-flow oxygen, and that within a week 20% of these oxygenated patients die or move to the ICU. These are fully made-up numbers btw, but they are not hugely removed from reality.
So to recap, 7*50=350 patients arrive in a week, 70 (20%) of those eventually require high-flow oxygen therapy, and within a week, 14 (20%) of those either die or get moved to the ICU.
Note that it is very hard to define a concrete endpoint to measure, and you might get it wrong even. For example, you might be measuring moving people to the ICU, but it could be that people you treated still did far better once there - but you’d miss that with the simple ‘sent to ICU’ endpoint!
A hospital might now try to prescribe a medicine on the general ward, and keep tabs on the number of oxygenated patients either dying or moving to the ICU.
Before the intervention, out of a population of 70 oxygenated patients, this number was usually 14.
Let’s assume the treatment being tried is pretty effective, and that it should prevent 50% of patients moving to the ICU or dying.
And a week later.. again 14 patients either die or progress to ICU. Much sadness all round, it didn’t work. But is that so?
Poisson distribution
If we plot what we could expect for this population, the following comes out:
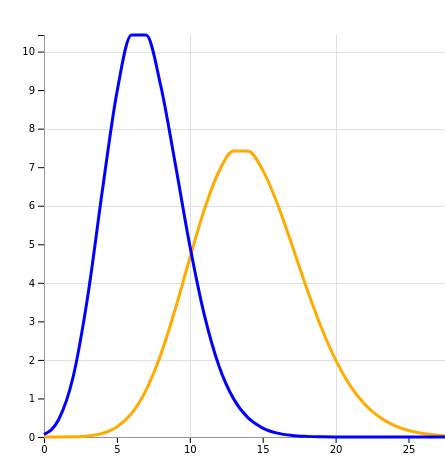
X-axis: number of cases, Y-axis: chance
The orange line is what we could expect without an intervention, or an ineffective intervention. The peak is at 14 patients meeting the ‘composite end-point’. And this is what we observed after a 1 week trial.
The blue line is what a 50% effective intervention looks like, and it indeed peaks at around 7 patients.
The problem now is that the blue and orange graphs overlap significantly. The blue line, describing a successful intervention, is most definitely not zero at 14 patients. In other words, our intervention could well be 50% effective, but we stand a >10% chance of not seeing any decrease in numbers!
Our sample size is just too small.
And conversely, let’s say after a week the number of progressions dropped from 14 to 7 - surely we could celebrate now. But no - the yellow “no successful intervention” graph is very much non-zero at 7. Again, we just don’t know.
Now let’s say we do a coordinated trial on several wards in lots of hospitals, and we now have data on 700 patients. Behold:
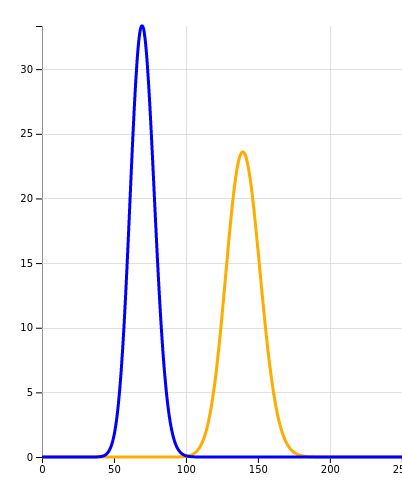
X-axis: number of cases, Y-axis: chance
The blue and orange graphs no longer meaningfully overlap. If we had now noted that the progression rate remained the same, we could be sure the intervention did not help. If the rate had halved, we could indeed start celebrating.
Why we need formal trials that take time
Armed with this knowledge, we can understand why one group reports success for a small scale trial while another group reports failure. The numbers are just too small. Now, people writing papers know all this, and they contort themselves into reporting ‘significant’ results based on small (’n=14’) trials. With sufficient torture, the data will always confess.
Later peer review, either formally or on Twitter, then tears these results apart, because in the end their numbers turn out to hinge on individual patients being excluded from the results, for example.
Nothing beats a well coordinated trial with a sufficiently large sample size. Such trials are ‘powered’ to deliver statistically strong results. Sadly, there is no rushing such coordination. Because even a large sample size does not save us from weak definitions or a host of other reasons why trials can be unreliable.
To end on good news, many many large scale trials are now ongoing, and some of them will be reporting soon. And meanwhile, whenever you see anecdotal reports (or even papers) from individual hospital settings, know that unless the results are stunningly impressive, you may well be seeing statistical noise.
Finally, if you want to try for yourself, fill out some numbers on this trial simulator I made and see what happens!