Optimizing optimizing: some insights that led to a 400% speedup of PowerDNS
So no matter how pretty your code, eventually someone will benchmark it and demand top performance. Squeezing microseconds is a very addictive and even destructive activity. It ruins your evenings, destroys your ability to converse with human beings and typically leaves your code in a mess.
No programmer can escape it however: the world demands speed, or a somewhat equivalent modern measure, longer battery life.
Squeezing out more performance is not just a matter of “writing better code”. There is an art to it. Over the past 30 years I’ve had some successes, but many performance improvements were way too long in coming. There is a lot of misguided advice out there too.
In this post, I will be highlighting some things I have learned over the years.
Note: this is not an optimization tutorial, but it may help craft a useful mindset.
Broad brush optimizations
So this really is the magic sauce (or snake oil if you will). “Don’t use reference counted pointers”. “Use lock-free code”. “Stay away from the STL”. This is typically rather useless and also rather unscientific advice, because it is hard to falsify.

Using tools sparingly
Sure we can point to a blazing fast project that used no exceptions, no RTTI and no dynamic allocations. But 1) this is not your project 2) the cost of such asceticism is enormous 3) we can’t even be sure if putting the code on that diet was actually what caused it to be fast.
One reason why such advice stays around is that it is very hard to implement or refute it. Perhaps it works, perhaps it doesn’t, but it typically requires revamping your whole project to find out.
The takeaway is, don’t give up on optimizations if your real world project uses such newfangled stuff as dynamic memory and exceptions, for there is little proof performance will suddenly zoom without it. Let alone that your project will ship on time.
Looking at the profile: The Big Impressive Improvement
So when starting to optimizing a codebase, there is frequently some impressive low hanging fruit. You do a performance profile and your project spends 50% of its time in one super slow function. Bam. Five minutes of work, double the performance.
I’ve had this with my Antonie DNA tool which turned out to spend most of its time doing powers of e to get an unimportant statistic right.
The rush of fixing such an issue is so powerful that this spoils us for all our other efforts to speed up code. We want other big hitters that jump out at us without too much thinking! But you can keep on hunting for them, they won’t come: the rest of the speedup is going to be actual hard work.
The mindset: the cpu / compiler / library / operating system / language is an idiot
I think this goes back to the 1980s, when all of this was true. Xor ax,ax was faster than setting ax to 0. The system random() call slowly delivered alternating odd and even numbers, all located on n-dimensional hyperplanes. You could help the compiler by replacing /8 by »3. Anything the operating system did, you could do better by bypassing it. And don’t get us started about the language with its dreaded function call overhead!
These days, it turns out that most obvious optimisations.. have already been done for you, either by the compiler or the CPU (both of which know a lot more about what your code is doing than you do).
Many of us have wasted a ton of time implementing userspace multitasking and asynchronous I/O, because surely those system threads must suck, only to find that the kernel knows a hell of a lot more about CPUs and I/O than we do. Our case just wasn’t special enough.
Similarly, many projects have forgone virtual methods (which use RTTI) only to reimplement them badly as a switch statement at the start of every method function. This is a tangible step backwards since compilers can often devirtualise calls, which your switch statement (or function pointer struct) can’t.
Very often our efforts to “help” the cpu/compiler/OS at best redo what was happening already, but also de-idiomized our code and otherwise made it far less readable. Without any speedup. More often, it turns out we actually made things worse.
As a notable exception, if you actually ARE on a known-slow platform, like Python for example, it does make sense to sidestep it to gain performance. But you might be in the wrong place to get fast software then anyhow!
So before you fall into the trap of assuming you can easily do better than your infrastructure, either pick better infrastructure or measure if things are indeed as dire as you think they are.
The flat profile: check the call graph
After the first big optimizations are done, you are often staring at a profile where there are a few unavoidable functions doing 20% of the work, plus a ton of them doing 2–5% each.
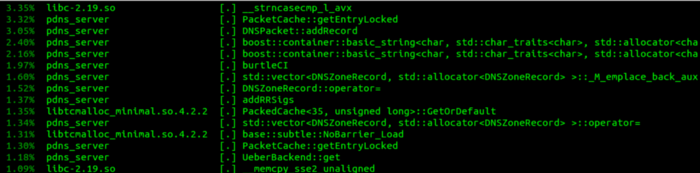
I’ve spent an inordinate amount of work speeding up such individual functions, but it is very depressing — you realise that even if you manage to speed up such a function so it takes no more cycles at all, you still only improved overall performance by 3%.
At first such flat profiles just stumped me and made me give up further optimization. However, with the advent of better profilers, I have learned that such flatness is deceiving.
You might spend 3% of your time each in 10 functions, and then discover that the 30% total time you spend there is because there is one higher order function calling all those little functions way too often. And this higher function never shows up in your flat profile!
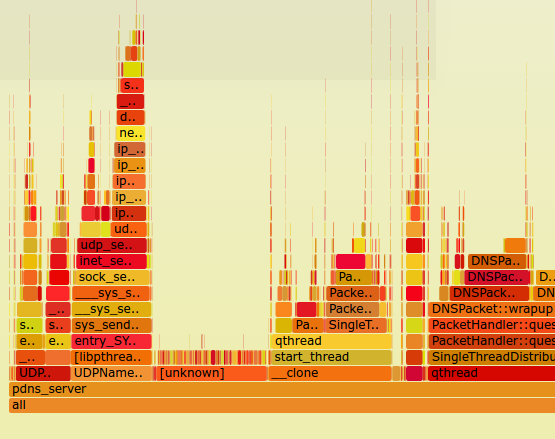
A PowerDNS Flame Graph made with http://www.brendangregg.com/perf.html#FlameGraphs. Actual data here
So the takeaway is: get call-graph based performance profiles. This is usually somewhat of a hassle, and frequently massively slower, but they are SO worth it to get beyond the long tail of functions taking 3% of your time.
Super-heroic optimizations
These are the olympics of speedups. The stories captivate us. Reading them personally makes me feel small and inadequate. If for example I would code up an AES encryption function it would be whole orders of magnitude slower than what the crypto superheroes out there have achieved. A modern AES implementation can do encryption in 11 clock cycles/byte, without special hardware assistance. In those 5 nanoseconds, it performs a ton of XORs and shifts. Whereas in 11 clock cycles, a normal programmer like me can barely count to 4.
Such heroic performance might be a reason to give up on optimization at all if you know for a fact you aren’t current with the pipelines and the vectorisation machinery on modern CPUs. But do not fear. Even such heroic programmers can only tease out this performance for very tightly defined and simple functions, and even then it takes them weeks.
So although there is much to admire in the people that can make all the speculative execution engines in a CPU spin, realize that they achieve such stellar performance by spending weeks on hundreds of bytes of code, something which rarely scales beyond encryption, hashing and codec libraries. Don’t feel too bad. Make grateful use of their work, and move on.
What everyone learns over time: do less
Everyone keeps reinventing this one. There is something “manly” (for lack of a better word) in doing brute force optimization of a function. But usually it gets you a 20% speed boost at best. Unless you are one of the people from the previous section of course!

Swoosh your code
The best way to speed up code is.. not to run it. It requires a very different mindset, not one that focuses on individual lines of code, or even functions. It involves truly understanding what your program is doing.
And after you have spent sufficient time, you frequently discover your code is retrieving 12 fields from a database, but only looking at one. Or even more interesting, it is looking at no fields at all, but actually storing all the rows in a vector, only to return its size.
John Carmack, of Doom and Quake fame, first opened me up to this point of view:
“It is almost always better to spend time reducing the total number of allocations versus implementing a custom allocator.” — John Carmack
I have spent more time on allocator improvements than I care to admit before writing some tooling to find out exactly where all these allocations were coming from. Reducing malloc traffic has had far greater effect than trying to optimize the actual allocator itself.
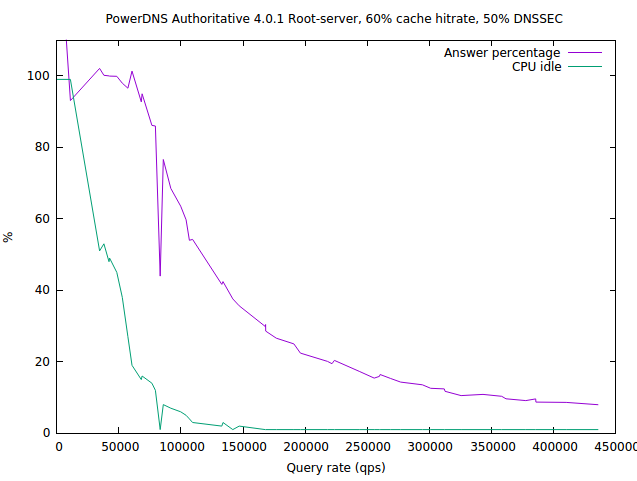
As a case in point, PowerDNS in 2016 launched a month-long optimization spree (which incidentally led to this article), and the final big “3x” speedup came when we discovered we were doing an inordinate amount of string manipulation to things we could also store in binary (parsed) form, turning an ascii/DNS roundtrip into an integer comparison.
So, when looking for further things to optimize, take a large number of steps back from the individual lines of code to figure out what exactly it is your code is trying to achieve, and if it is in fact maybe doing way too many things as compared to doing things too slowly.
The law of marginal^H^H^H^H^H^H EXPONENTIAL returns
This one really hit me in the face. PowerDNS Authoritative Server needed not just a 20% speedup, we needed whole factors of improvement on a certain important workload. So when I started, I quickly found two algorithmic optimizations that each delivered a 15% performance boost. Meh. So I did not pursue this angle, because 15% speedups don’t get you to a 200% speedup. Or do they?
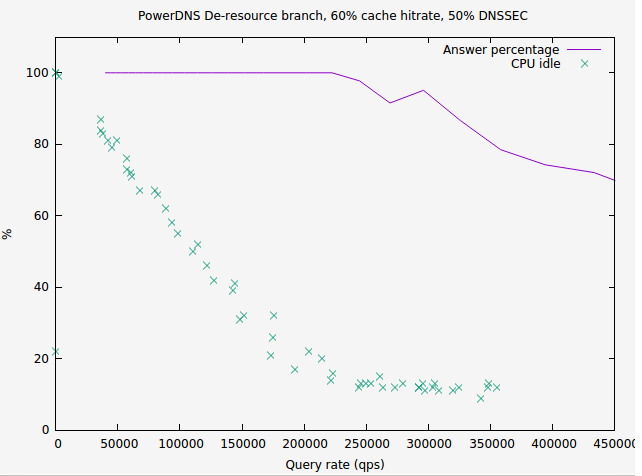
After I spent a few days on major refactoring to achieve a worthwhile performance increase of 50%, I pondered what to do next. I had taken a 100 microsecond operation down to a 50 microsecond operation. And then it hit me. Those 15% speedups I discarded were worth 15 microseconds each. And they would come out of the 50 microsecond budget now! So our 30% combined speedup suddenly became a.. 60% speedup! We go from 50 microseconds/op to 20 microseconds/op, more than twice as fast.
Now this only works for fully independent optimizations, but this is frequently what you will find — operations that consist of many steps, and your individual speedups only hit some of those steps.
In retrospect, this should not have come as a surprise. The sqlite project had achieved an incremental doubling in speed through micro-optimizations in 2014.
So the takeaway is, whenever you are shaving “15%”, realize you may actually be shaving clock cycles and not percentages, and that each of these cycles will become incrementally more important in the face of other optimizations. Before you discard a mere 15% improvement, realize it might turn into a 30% improvement before the end of the day!
Wrapping it up
- That other project that is so fast, the one that doesn’t use any features? Be aware that 1) it is another project 2) their asceticism is surely costing them time, but may not be what makes them fast
- Think twice, thrice, before reimplementing infrastructure functionality. Are you actually smarter than full time compiler/cpu/OS designers?
- The Big Massive Improvement from fixing one function: this only happens once. Further improvements will be very hard work. Prepare for a slog.
- The flat CPU profile: invest in call-graph based profiling. Get flame graphs.
- Those ‘0.4 cycles/byte’ speed records are great. Use that work. But it is not feasible for large scale code, so don’t feel bad you can’t do it for your spreadsheet.
- Just Do Less.
- Don’t knock the initial 15% improvements. Once you have achieved other speedups, relatively speaking, your 15% speedups might add up to a doubling of performance. The law of exponential returns.
GOOD LUCK! And if you have any personal insights in speeding up code, please share them. Perhaps there is room to optimize this article!