Recently, I've been doing work on the Antonie open source DNA analysis software , and as part of that work, I've been generating a lot of statistics (for a sample, see here).
In the process of that, I found that I could not get two important metrics to agree with each other, and notably, that two important vendors of DNA sequencers couldn't either.
In this paper, Life Technologies claims their PGM platform exhibits superior performance compared to the Illumina MiSeq. In turn, Illumina has responded with a paper of their own, in which they state Life Technologies has it all wrong, using the same data.
While I don't think the story below explains the discrepancy (it is rare for vendors to come out and say the other guy is better), in trying to solve my own two graphs not agreeing, I learned a few things that I want to share here.
When reading DNA bases, sequencers not only read the DNA nucleotides, they also supply an indication how how sure they are they 'called the base correctly'. This indication is called a Phred score, or Q-Score: $$ Q_\text{sanger} = -10 \, \log_{10} p $$ Here, \(p\) stands for the estimate of the probability the base was miscalled. Typically, 'Q30' reads are considered to be a benchmark, and this would then correspond to a 0.1% chance of getting it wrong. Q20 would be 1% etc.
Interestingly, when sequencing a mostly known organism (in other words, we have a good reference), we need not rely solely on the vendor reported Q score, we can actually observe how often they called it wrong. This of course only works as long as our organism is quite close to the reference - otherwise we get the real possibility that the machine is doing a great job but that the actual DNA is "in error!".
This then allows us to make bulk statements ('in reality, we miscalled 1.0%, the machine said 1.1%'), or to derive statistics on specific kinds of reads. For example, all current platforms don't read entire genomes in one go, but instead sequence small snippets of (say) 150 bases. It is often reported that quality scores go down further down a 'read', and it would be good to plot that.
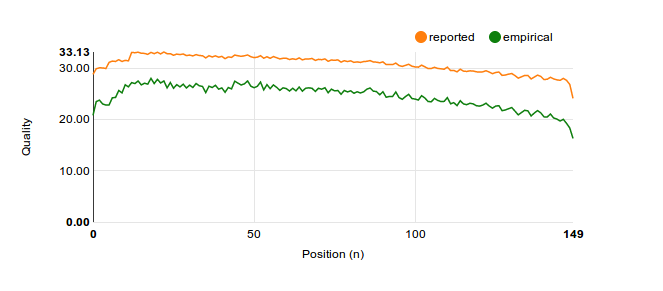
So I did, and lo, it appeared that just like Life Technologies averred, the Illumina MiSeq was vastly overstating its own accuracy:

This graph reminded me from what I'd seen in the Illumina paper rebutting Life Technologies' claims, and there I'd also seen that Illumina suggested the 'Q-Q plot' as a superior way of comparing qualities.
In this plot, whenever we note a correctly or an incorrectly called base, we tally this success or error in a bin for the reported quality score. So if we had 999 correct calls with Q30, and one incorrect call with Q30, we'd use those two numbers to calculate the empirical Q-score. And in this case, with a 0.1% error rate, we'd get Q=30 - and we could consider the setup to be well calibrated.
Here's the Q-Q plot that we generated for the same data, where the area of the circle denotes how often we saw that Quality score being reported:

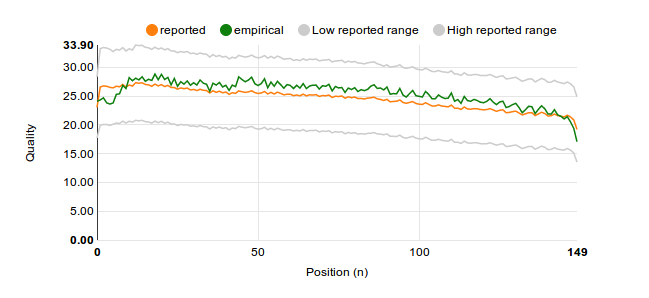
And clearly, the second graph says that our MiSeq is doing just fine. The reported and observed qualities agree very well, and the machine is definitely not lying about its qualities. So how come the graphs disagree so much?
To generate the first graph, we needed to average the Q-scores. When done naively, we would average one call of Q10 and one of Q30 together as Q20. And we'd be very wrong! As has been noted, doing it this way is a very bad idea
Let's say we do 1000 reads at Q10 and 1000 at Q30. For Q10, the error rate is 10%, so we get it wrong 100 times. For Q30, which means one-in-a-thousand, we get it wrong just once. So together, we made 101 mistakes for 2000 reads. This corresponds to \(p=0.0505\), or \(Q_\text{sanger}=12.97\).
Note how different this is from our naive estimate of Q20!
The proper way to average Q values is to either 'write it out' like we did above, or to use this formula: $$ Q_\text{average} = -10 \, log_{10} \frac{\sum\limits_{i=0}^N{10^{-Q_i/10}}}{N} $$
Once this formula is used, and we've also taken the time to compute the standard deviation so we can draw a reasonable expected range, out comes:

Some closing notes: 1) Calculating exponents is computationally surprisingly expensive. However, since you'll be calculating only the same 40 quality scores or so, it makes sense to precalculate the \(p\) values at startup. 2) Don't forget, like I did, to not use the natural logarithm. Use \(log_{10}\) - otherwise your results will look plausible, but won't be.