Dutch Electrical Power Numbers part 2
In an earlier post I presented a naive model for estimating Dutch electrical solar power generation numbers. It turns out that the Dutch electrical power generation numbers are an even bigger mess than I appreciated.
It appears that “everyone knows” that the numbers are confusing, incomplete and perhaps even wrong. But somehow this state of confusion isn’t written down anywhere.
So I’ll give it a shot.
A round of thanks to a small number of anonymous industry insiders that provided invaluable help!
The Dutch energy TSO (TenneT) states on its website “Our vision is to be one of the most transparent Transmission System Operators (TSO) in Europe and thereby creating value for society”. This may be true in some respects, but it is definitely not true for the data reported to the European Network of Transmission System Operators for Electricity (ENTSO-E) transparency platform.
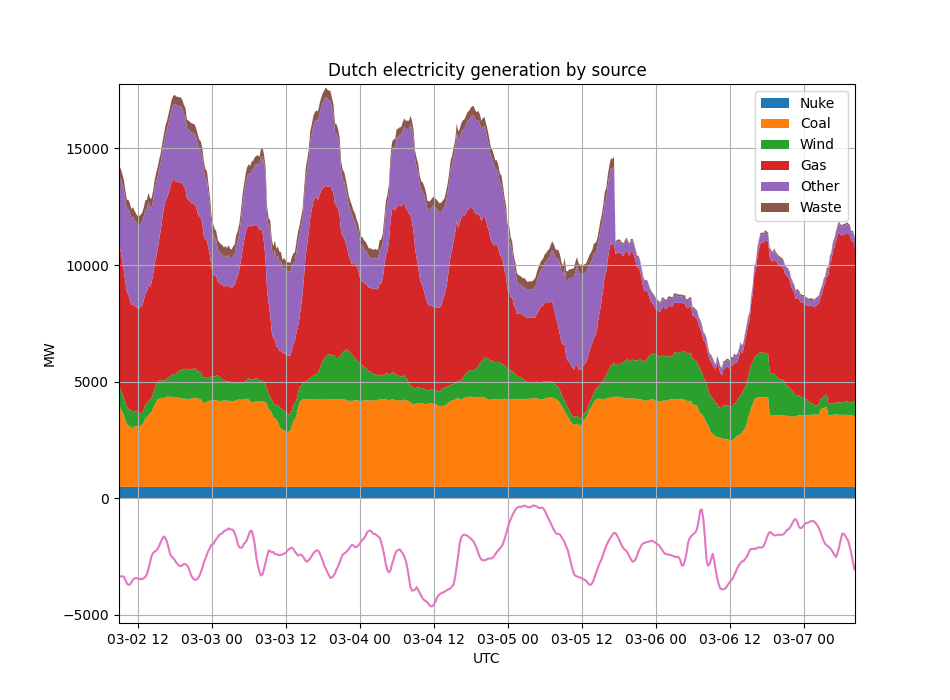
As of April 2022, TenneT reports the following kinds of electrical power production to ENTSO-E:
- Nuclear. These numbers appear to be correct, and come from our single operational nuclear power plant in Borssele.
- Fossil gas. I think this includes only our ‘regular’ natural gas power plants. However, other sources authoritatively say we also burn a steady 458 MW of ‘biogas’.
- Coal. Probably complete. But might include ‘biomass’.
- Waste. The Netherlands incinerates a lot of (national and imported) waste, and this leads to the production of electrical power. Not a lot though.
- Wind onshore. Turns out this number only includes wind farms directly connected to TenneT. In other words, there is a lot more onshore wind power than reported in this number.
- Wind offshore. Most people consider this number to be good & to include all the offshore wind farms.
- Solar. I have no idea what this is. Our solar production is estimated to be over 10 GW now, this number is around 100 MW.
- Other. No one knows what this is (!!), except it sometimes peaks to 5 GW. But not recently. Goes up and down between 50 and 600 MW more or less. Speculation is that this might be combined heat and power (CHP).
TenneT supplies the following statement on its ENTSO-E page:
TenneT NL: The publication represents the generation identifiable per fuel type, if not identifiable the data is published as “others” or not published. Data on Solar is mostly not available.
From the statement, we can derive that there might be other kinds of power which could end up under the ‘other’ category, or maybe just not published at all. We have no idea what this ‘other’ category represents.
It is not clear to me if our ‘biogas’ production numbers are included in here, and if so, where. It may also be that this biogas does not exist, but is actually regular natural gas that has been CO2 compensated. Who knows.
It is very clear however that we do not report a single Watt of solar power. This in a way is good because it is at least clear.
The reported solar numbers are around 100 MW in peak, but this is clearly less than 1% of the actual installed solar power base.
It may be clear, but it is likely also in contravention to Commission Regulation (EU) No 543/2013 of 14 June 2013 on submission and publication of data in electricity markets.
It is also reported that The Netherlands burns ‘biomass’, but the corresponding ENTSO-E field is empty. Perhaps this is reported as coal?
I have asked TenneT if they could clarify the numbers, and recently they got back to me. Will update this page as more information becomes available!
Exports and imports
TenneT currently reports the imports and exports of electricity with the UK, Norway, Denmark, Germany and Belgium. We assume this is the complete list.
What to make of it
If you add up all the known Dutch electrical power generation and subtract the exports, you are left with how much energy is known to be supplied to Dutch houses and industry. What you then don’t see is any of the solar power (‘behind the meter’ and industrial), plus the unreported wind power.
We also don’t really know how much electricity we use. Various people assume this is 16 GW in peak, but I have not found any recent numbers on that. Which is odd since we equipped almost everyone with “smart meters” (if they wanted them or not), so we should be in a position to know. But it turns out that even insiders don’t really know.
All this means that if you want to find out how much solar and wind power we are actually producing, you are going to have to make a lot of assumptions.
If you see Dutch graphs reporting that ‘45.4%’ of all electricity was generated from green sources this week, do know they are likely overstating their precision hugely. ‘Between 40% and 50%’ would perhaps be a more reliable claim (and I’m not even sure of that).