SkewDB
Welcome to SkewDB! A free database of GC and many other skews for over 53,000 chromosomes and plasmids (viewer, blog post).
The Scientific Spring Meeting KNVM & NVMM 2022 presentation is here (pdf). And now also on YouTube as video!
SkewDB, a comprehensive database of GC and 10 other skews for over 30,000 chromosomes and plasmids, Nature Scientific Data, 2022
doi:10.5061/dryad.g4f4qrfr6

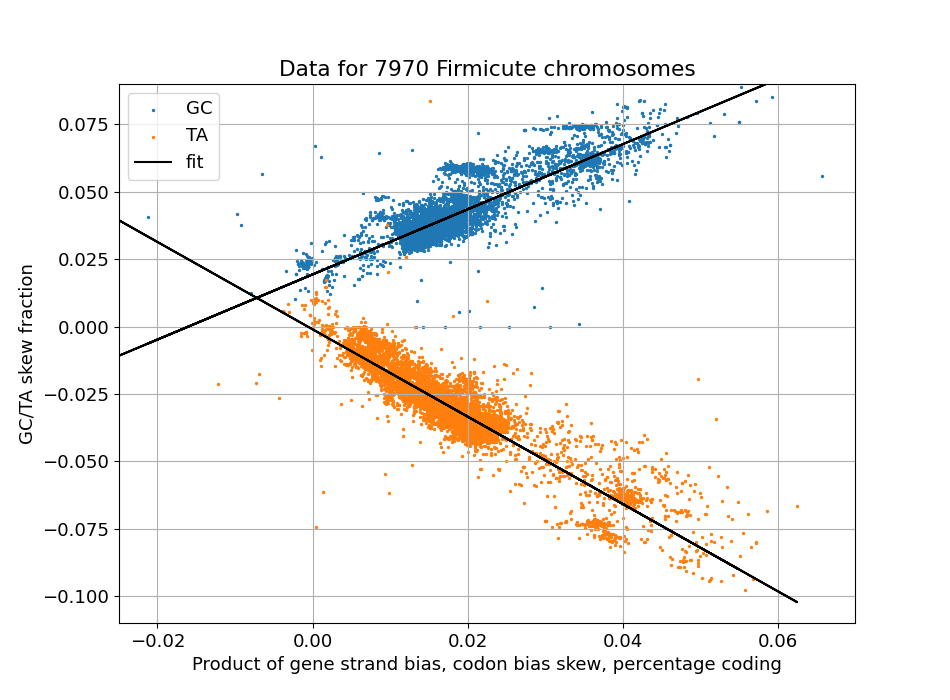
Scatter plot of observed GC skew levels (y axis) and a calculated predictor (x axis)
This database is created by the open source Antonie software, based on public DNA sequence, annotation and taxonomic data as gathered from NCBI data.
In addition, for all 53974 chromosomes and plasmids, individual files are available that show all the various skews with 4096-nucleotide granularity. This is good for creating plots or studying local chromosome behaviour.
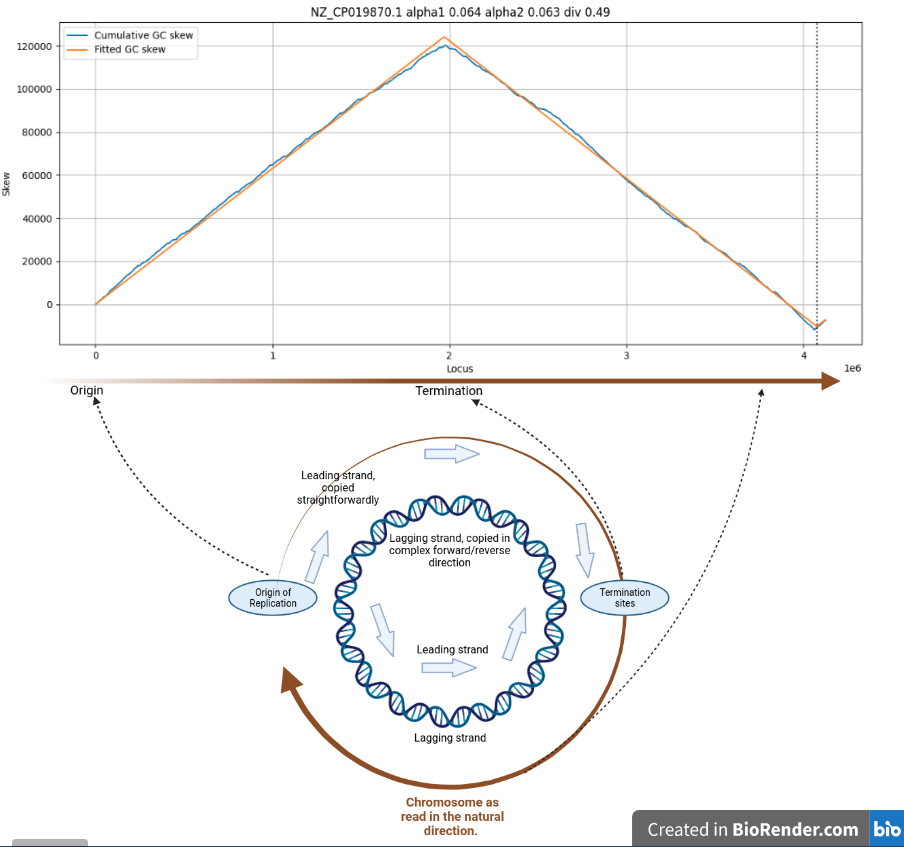
Cumulative GC skew for C. difficile
Here are the relevant files:
- The Antonie SkewDB as CSV
- The 53,974 files showing the fit per chromosome (tar.bz2)
- and the simple Jupyter notebook that shows most of the graphs from this page
- a README that describes all fields (but also see the rest of this page)
You can also query the database directly here.
SkewDB was created by bert hubert based on public DNA sequence, annotation and taxonomic data. It is wonderful that all this data is available. The hope is that SkewDB can support further research into chromosomes showing GC skew.
If you’ve been able to benefit from SkewDB data, please do find a way to cite the project. The preprint that describes the data is also on BioRxiv, it can be cited as:
SkewDB: A comprehensive database of GC and 10 other skews for over 28,000 chromosomes and plasmids
Bert Hubert
bioRxiv 2021.09.09.459602; doi: https://doi.org/10.1101/2021.09.09.459602
The database itself also has a doi, doi:10.5061/dryad.g4f4qrfr6.
Some informal background is available in these three blog posts.
Meanwhile do contact me on bert@hubertnet.nl if you have any questions!
Contents
Here is what you’ll find in the SkewDB. Fields that have no description should be ignored, unless you want to delve into the source to find out what they are. Also consult the preprint.
| name | NZ_CP019870.1 | Sequence identifier |
|---|---|---|
| fullname | NZ_CP019870.1 Clostridioides difficile strain BR81 chromosome, complete genome | Full name |
| acount | 1468605 | Number of A nucleotides in chromosome |
| ccount | 595727 | Number of C nucleotides in chromosome |
| gcount | 588291 | Number of G nucleotides in chromosome |
| tcount | 1471761 | Number of T nucleotides in chromosome |
| realm1 | Bacteria | Taxonomic data |
| realm2 | Terrabacteria group | Taxonomic data |
| realm3 | Firmicutes | Taxonomic data |
| realm4 | Clostridia | Taxonomic data |
| realm5 | Clostridiales | Taxonomic data |
| flipped | 0 | If this genome was 'flipped' because it was sequenced in the "wrong" order |
| siz | 4124383 | Number of nucleotides in chromosome |
| gccount | 1184018 | Number of GC nucleotides in chromosome |
| ngcount | 684359 | Number of non-coding nucleotides in chromosome |
| acounts2 | 474821 | Number of A nucleotides in the 3rd codon position |
| ccounts2 | 101127 | Number of C nucleotides in the 3rd codon position |
| gcounts2 | 100290 | Number of G nucleotides in the 3rd codon position |
| tcounts2 | 470372 | Number of T nucleotides in the 3rd codon position |
| alpha1gc | 0.06388 | Gradient of G excess compared to C on leading strand |
| alpha2gc | 0.063053 | Gradient of C excess compared to G on lagging strand |
| shift | -47650 | How far the chromosome had to be rotated to start at the Origin of replication |
| div | 0.489762 | Ratio of sizes of leading and lagging strands |
| alpha1ta | -0.064201 | Gradient of T excess compared to A on leading strand |
| alpha2ta | -0.066181 | Gradient of A excess compared to T on lagging strand |
| alpha1sb | 0.582759 | Gradient of gene excess on leading strand |
| alpha2sb | 0.595694 | Gradient of gene excess on lagging strand (same sign) |
| alpha1gc0 | 0.044523 | Excess of G over C in the first coding codon position on leading strand. Detrended, so the codon bias has been subtracted |
| alpha2gc0 | 0.046124 | Excess of C over G in the first coding codon position on lagging strand. Detrended, so the codon bias has been subtracted |
| alpha1gc1 | -0.00456 | Same, second codon position |
| alpha2gc1 | -0.004271 | Same, second codon position |
| alpha1gc2 | 0.013686 | Same, third codon position |
| alpha2gc2 | 0.014115 | Same, third codon position |
| alpha1ta0 | -0.034711 | Excess of T over A in the first coding codon position on leading strand. Detrended, so the codon bias has been subtracted |
| alpha2ta0 | -0.035573 | Excess of A over T in the first coding codon position on lagging strand. Detrended, so the codon bias has been subtracted |
| alpha1ta1 | -0.007392 | Same, second codon position |
| alpha2ta1 | -0.008421 | Same, second codon position |
| alpha1ta2 | -0.014013 | Same, third codon position |
| alpha2ta2 | -0.015103 | Same, third codon position |
| alpha1gcNG | 0.008434 | Excess of G over C in non-coding nucleotides on the leading strand |
| alpha2gcNG | 0.008888 | Excess of C over G in non-coding nucleotides on the lagging strand |
| alpha1taNG | -0.007312 | Excess of T over A in non-coding nucleotides on the leading strand |
| alpha2taNG | -0.007842 | Excess of A over T in non-coding nucleotides on the lagging strand |
| rmsGC | 0.000818 | Relative Root Mean Square error of fit. This is per nucleotide and scaled. 0.000818 represents on average a 0.08% error, per nucleotide position |
| rmsTA | 0.001317 | |
| rmsSB | 0.00128 | |
| rmsGC0 | 0.001125 | |
| rmsGC1 | 0.003669 | |
| rmsGC2 | 0.000957 | |
| rmsTA0 | 0.001566 | |
| rmsTA1 | 0.002921 | |
| rmsTA2 | 0.002964 | |
| rmsGCNG | 0.00211 | |
| rmsTANG | 0.002764 | |
| gccontent | 0.287078 | GC fraction of chromosome |
| ggcfrac | 0.626893 | |
| cgcfrac | 0.373107 | |
| ttafrac | 0.438995 | |
| atafrac | 0.561005 | |
| gfrac | 0.188601 | Which fraction of coding nucleotides ("genes") is G |
| cfrac | 0.11225 | Which fraction of coding nucleotides ("genes") is C |
| tfrac | 0.306923 | Which fraction of coding nucleotides ("genes") is T |
| afrac | 0.392226 | Which fraction of coding nucleotides ("genes") is A |
| leadafrac | 0.392415 | |
| leadcfrac | 0.11233 | |
| leadgfrac | 0.187254 | |
| leadtfrac | 0.308 | |
| lagafrac | 0.391272 | |
| lagcfrac | 0.112402 | |
| laggfrac | 0.189846 | |
| lagtfrac | 0.30648 |